Shopping
Shopping Attitudes
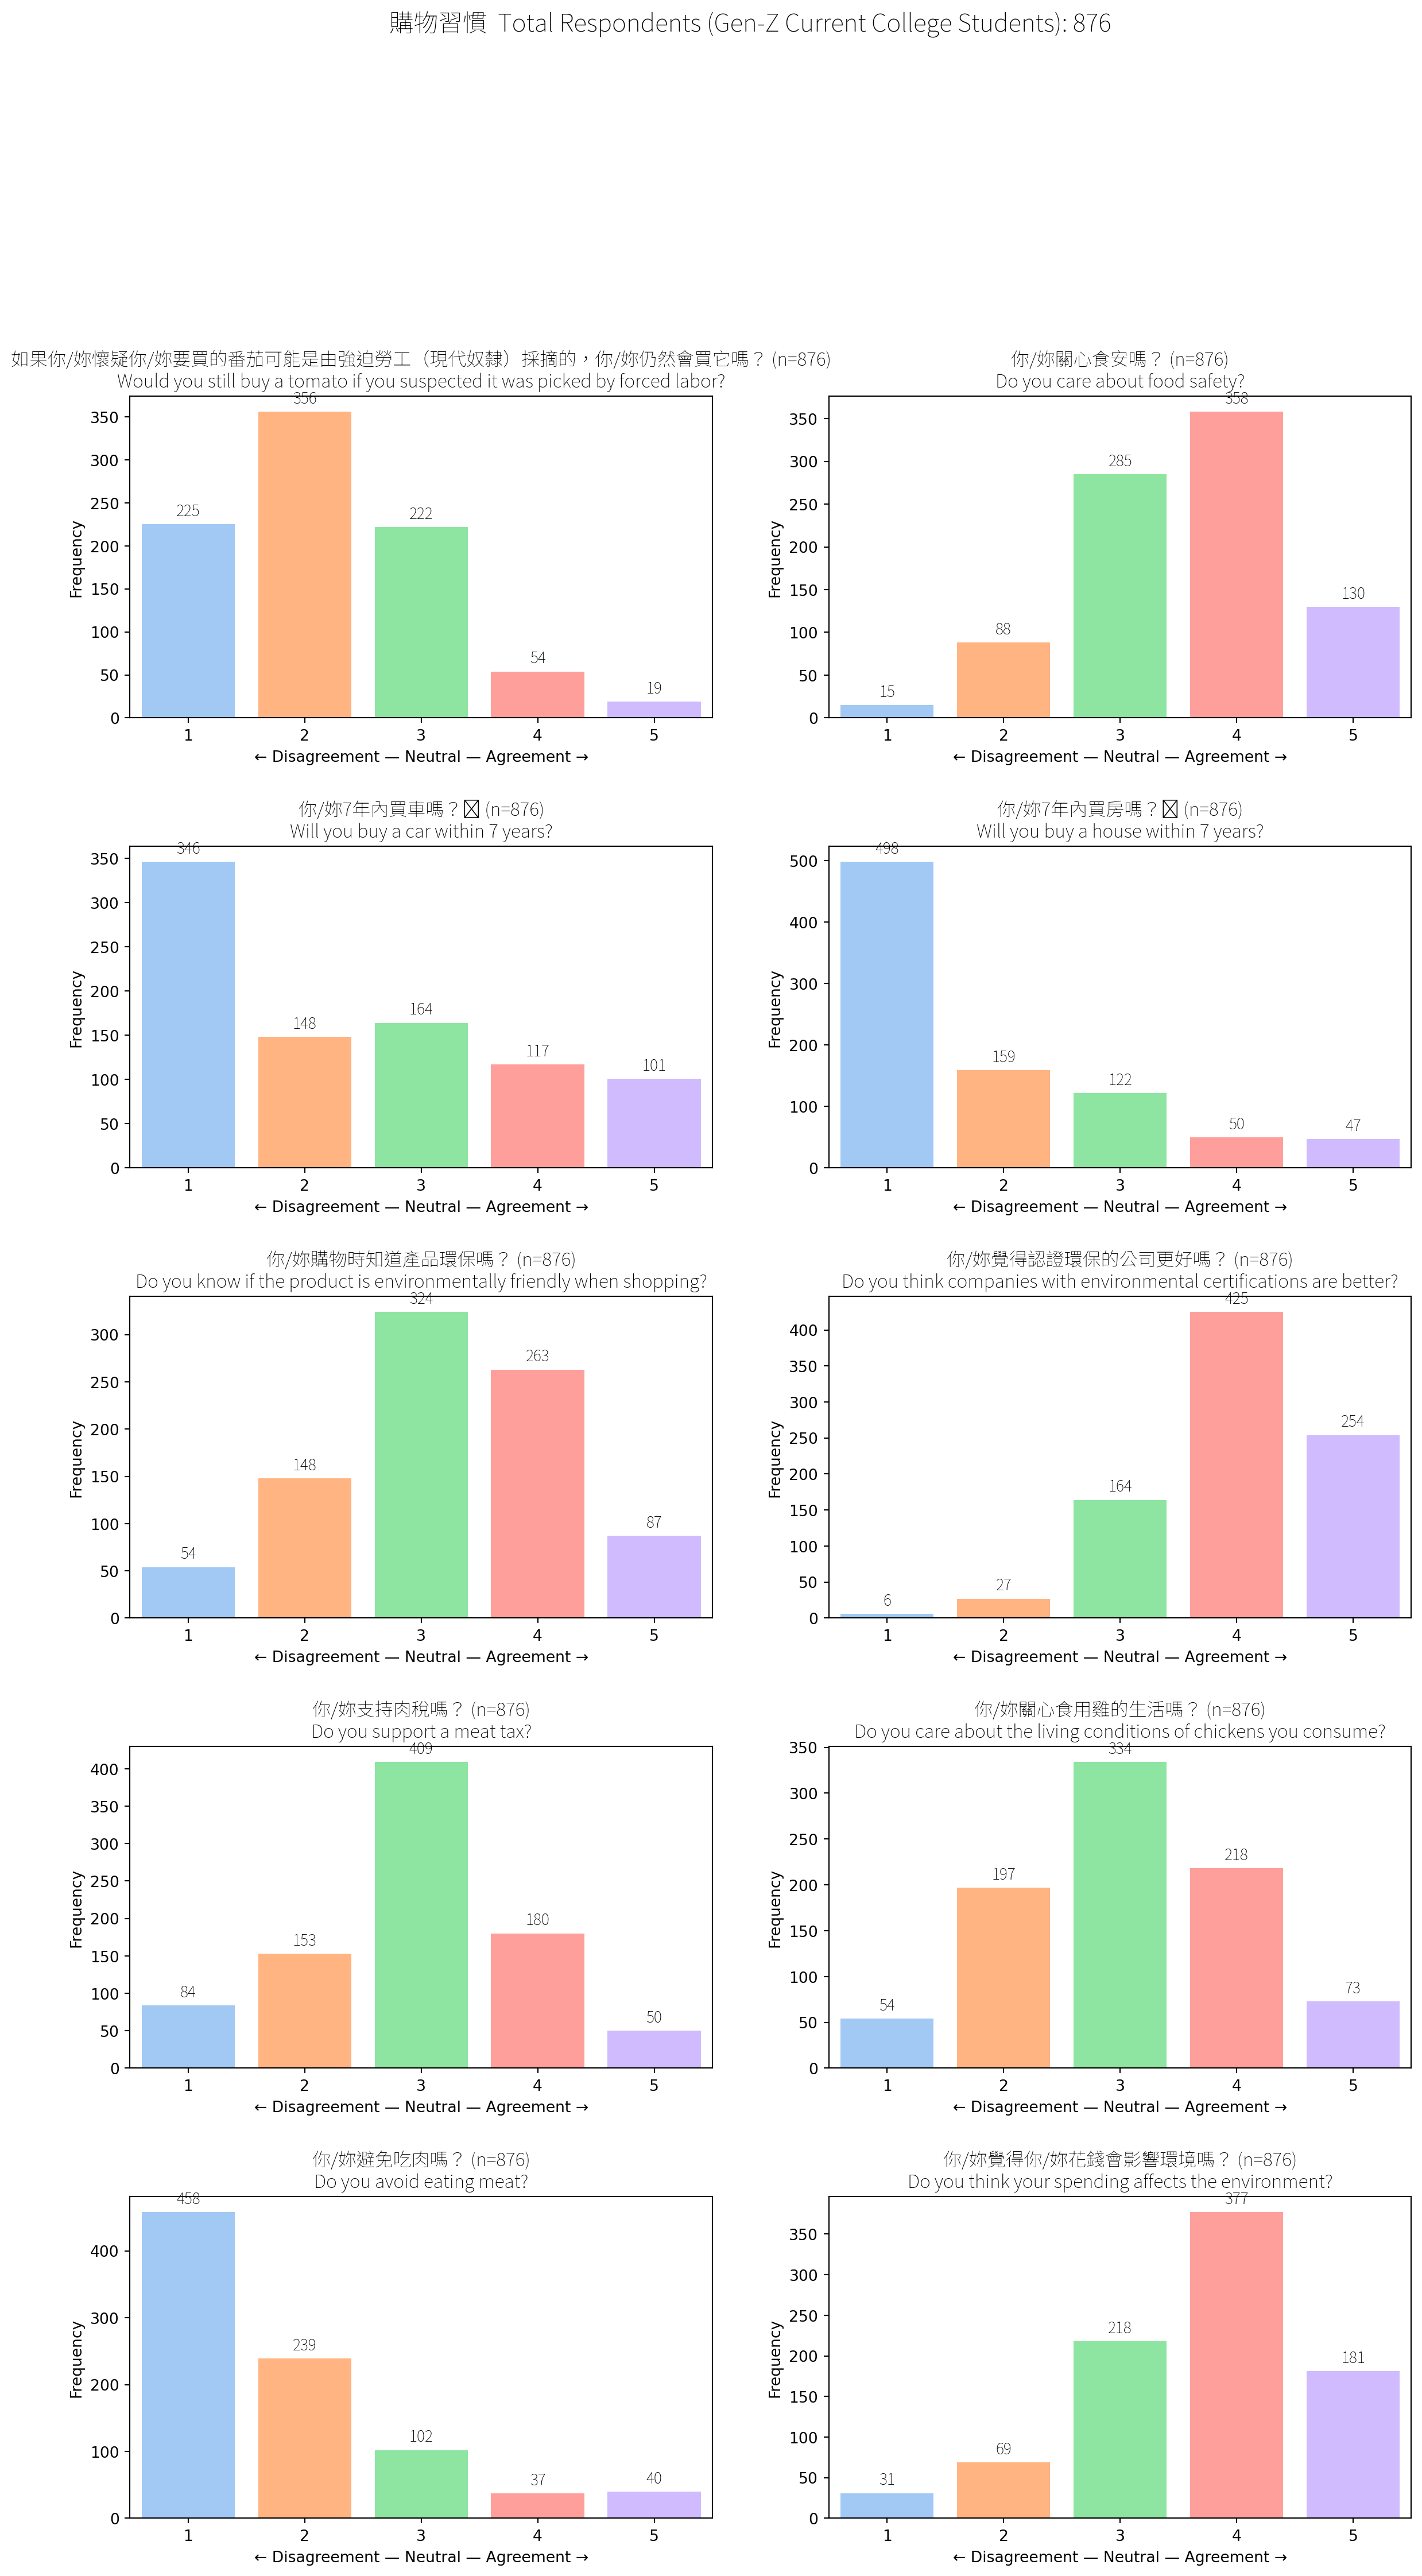
Figure 1: College Student Attitudes Towards Shopping
Interpreting the findings.
| Question | Interpretation |
|---|---|
| Would you still buy a tomato if you suspected it was picked by forced labor? | Most respondents chose 2 or 1 which I interpret as “Nope, I wouldn’t buy it.” - only a small fraction of the respondents choosing 4-5 would ignore the labor issue. |
| Do you care about food safety? | The choices peaks at 4, then 5. Nearly everyone is on the caring side; indifference and denial are tiny. |
| Will you buy a car within 7 years? | The mode is 1, plus decent counts at 2. A clear majority of respondents do not expect to purchase a car soon. My interpretation: maybe they’re fine with their scooter (!= car, see the question about how they arrive to school), use public transit or are just broke students. |
| Will you buy a house within 7 years? | Even more lopsided: a mountain at 1. Housing feels out of reach for the respondents. |
| Do you know if a product is environmentally friendly when shopping? | Bell-ish curve peaking at 3-4. People feel some awareness, but confidence isn’t universal. This might also reflect they don’t fully understand the question. |
| Do you think companies with environmental certifications are better? | Strong skew right: bars climb from 3 → 4 → 5. The badge matters and most respondents see certified firms as the good guys. |
| Do you support a meat tax? | Centered on 3, with noticeable flanks at 2 and 4. Opinion is split; lots are neutral, some yay, some nay. Again, this might indicate respondents don’t fully understand the question. |
| Do you care about the living conditions of chickens you consume? | Mode at 3, healthy bump at 4. People lean caring, but not super strongly. |
| Do you avoid eating meat? | Tall stack on 1, smaller on 2. So most do not avoid meat; only a sliver sits at 4-5. |
| Do you think your spending affects the environment? | Big jump at 4, next at 5, tiny left tail. Consensus: “My wallet choices matter.” This is an important finding to justify Green Filter. |
The following charts show the results including data from the partially-filled surveys. The extra ~300 partial responders barely move the needle, with every question’s modal answer staying exactly the same, and all the peaks and valleys shift by at most 1–2 percentage points. If anything, the full-sample (n ≈ 1,180) show more neutrality (slightly fewer “strong disagree” or “strong agree” ticks) and a tiny uptick in agreeing that certified companies are better and that your spending matters.
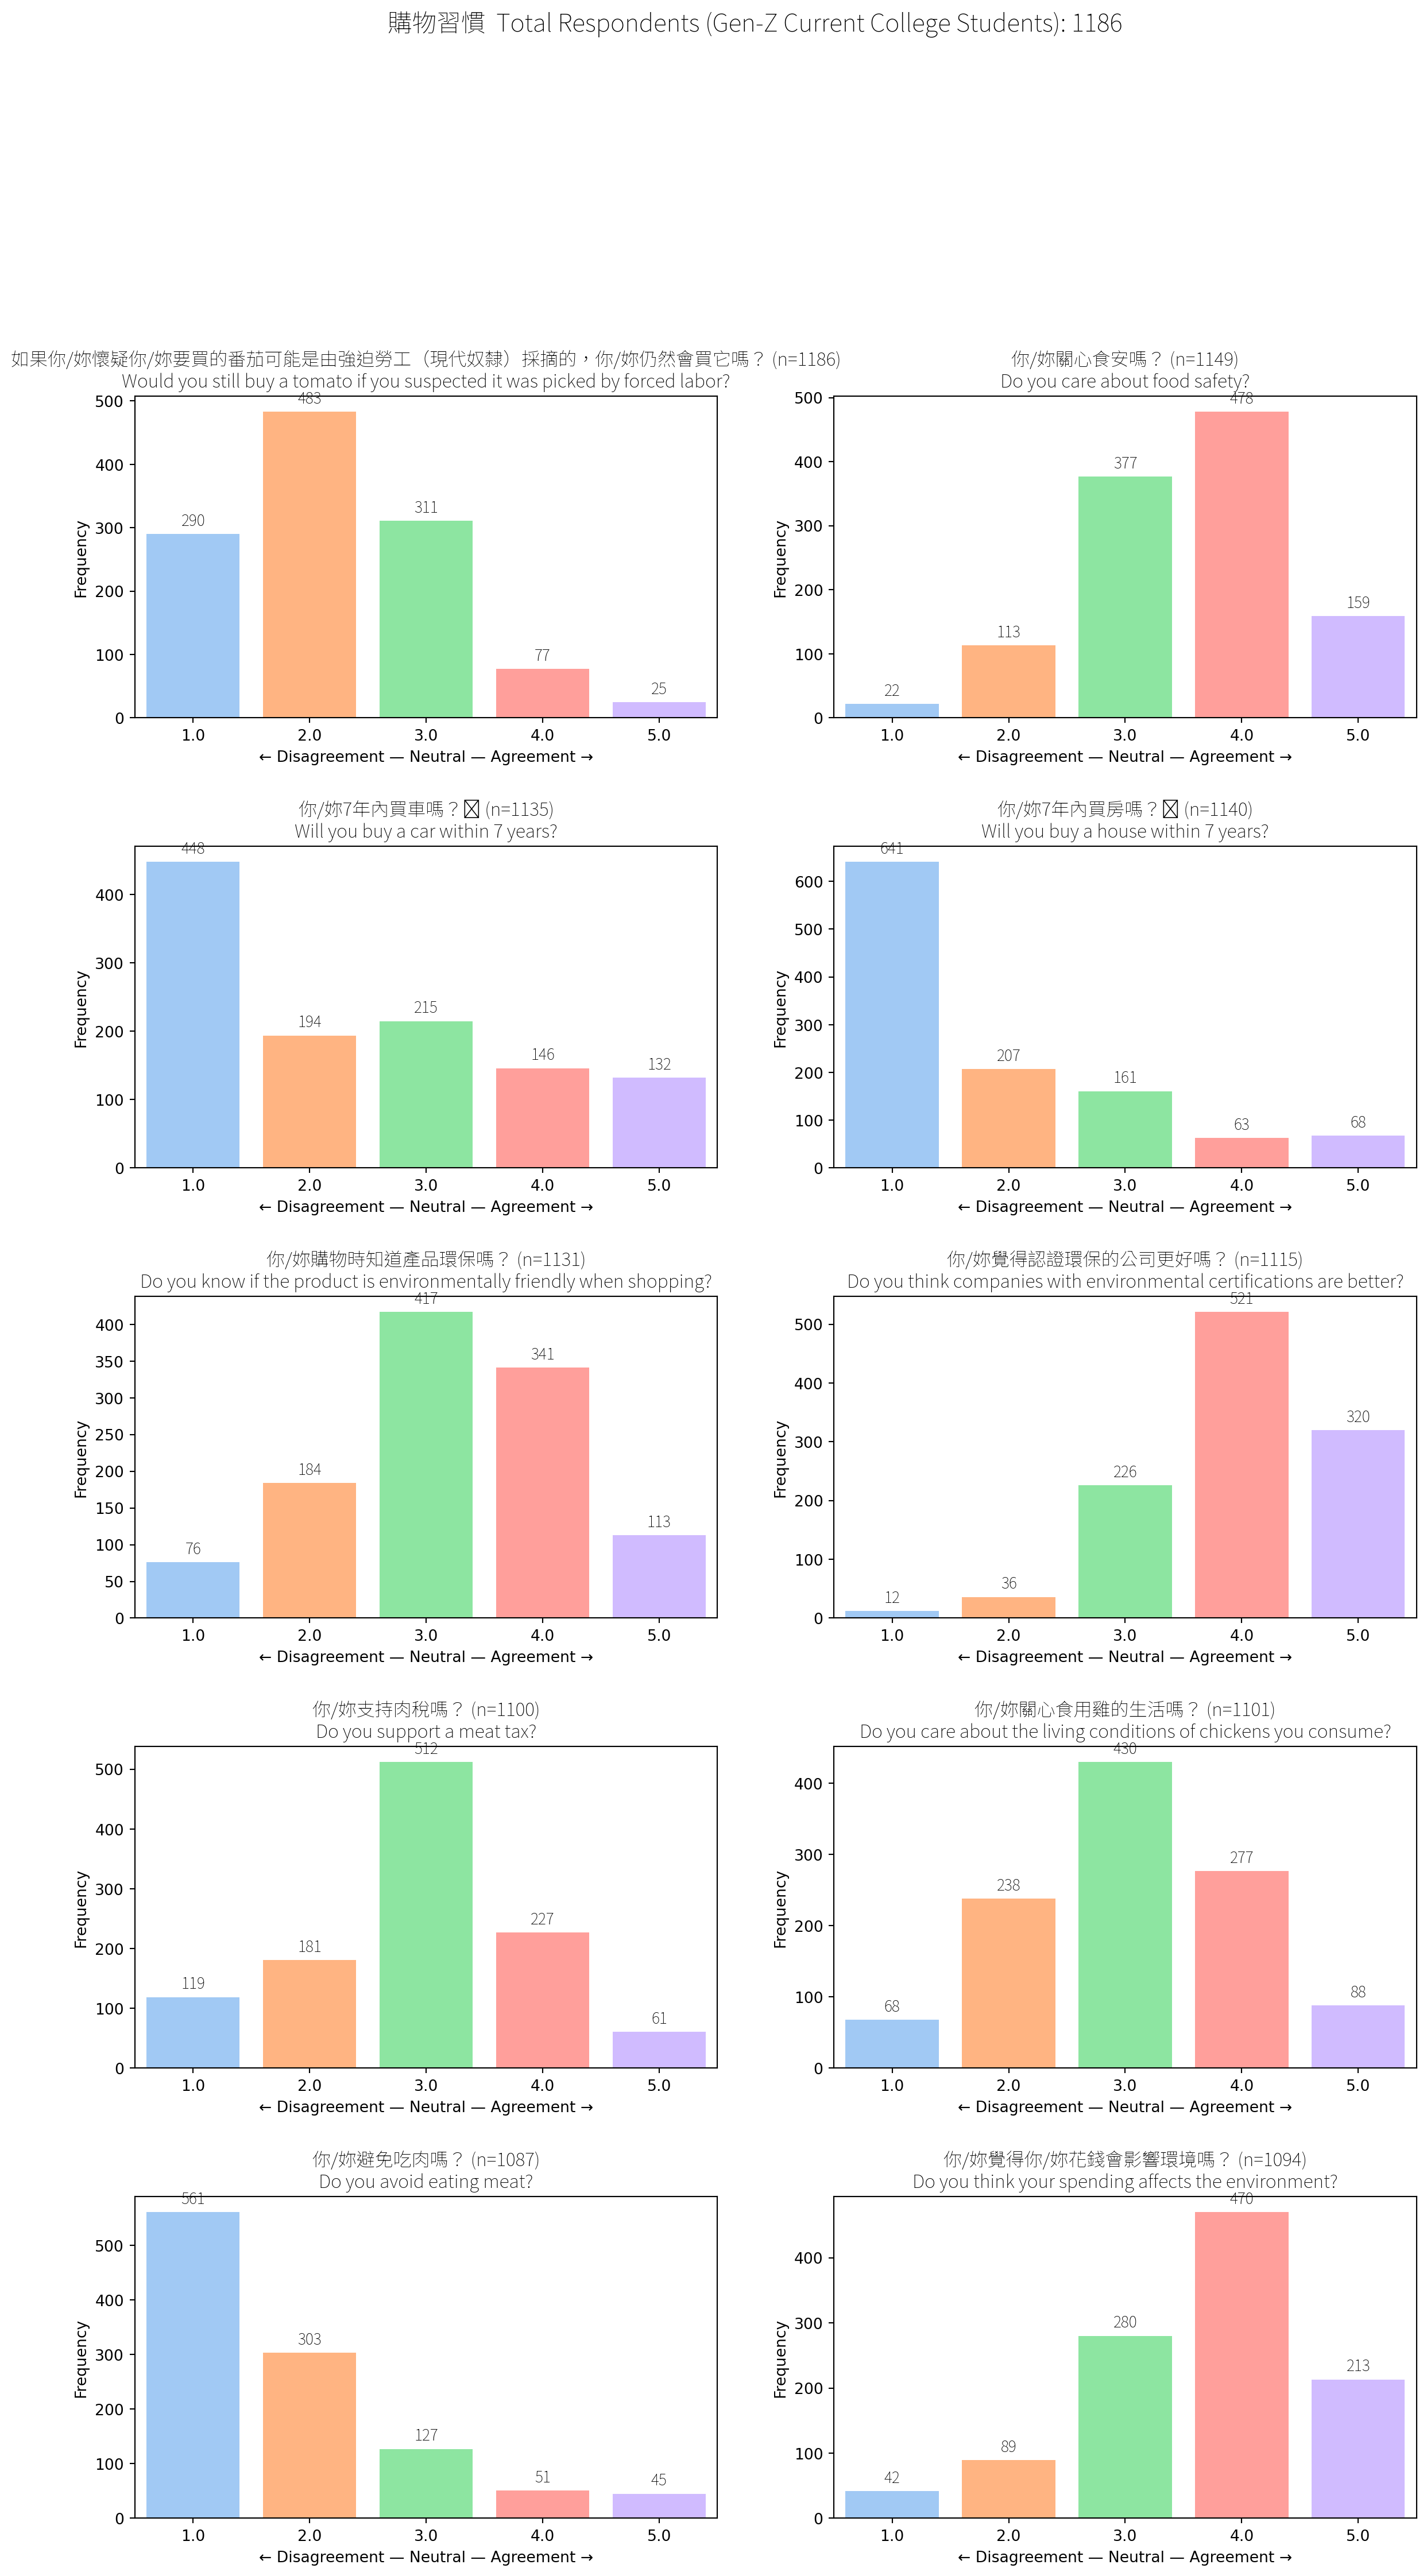
Figure 2: Partial: College Student Attitudes Towards Shopping
Design implications:
-
A majority of the respondents don’t plan to buy a house or car within 7 years: don’t focus on these categories
-
Majority don’t fly much: don’t focus on flights.
Boycott Count (Overall)
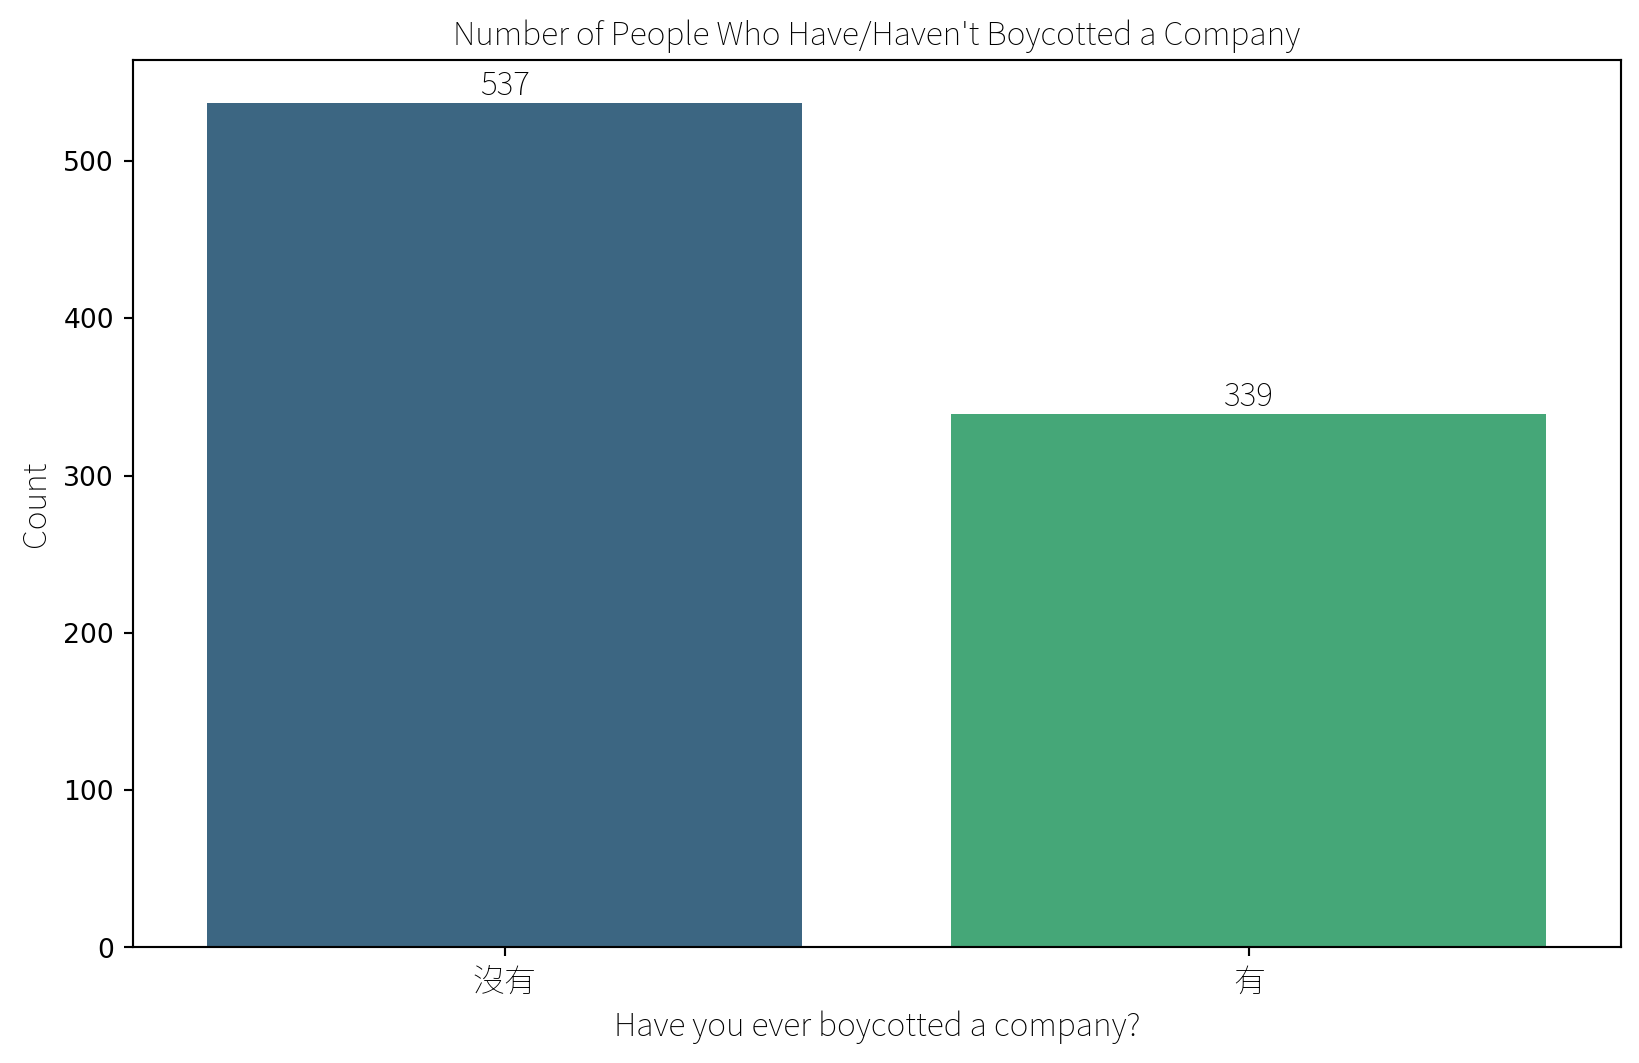
Figure 3: College Students Boycott Experience
| Option | Count | Share of sample |
|---|---|---|
| 沒 有 – Never boycotted | 537 | ~61 % |
| 有 – Have boycotted | 339 | ~39 % |
About 2 out of 5 college students have actively refused to buy from at least one brand, while a clear majority hasn’t taken that step.
Why Boycott?
| Reason | Count | |
|---|---|---|
| 0 | 食安問題 | 40 |
| 1 | 地溝油 | 12 |
| 2 | 黑心油 | 10 |
| 3 | 食安 | 8 |
| 4 | 政治因素 | 4 |
| ... | ... | ... |
| 219 | 喜好問題 | 1 |
| 220 | 因為我覺得它們不好 | 1 |
| 221 | 沒有社會企業良心 | 1 |
| 222 | 因為黑心 | 1 |
| 223 | 有食安問題,避免自己吃了出事 | 1 |
224 rows × 2 columns
Figure 4: College Students Boycott Reasons
Top motives among the 339 “Yes” answers.
-
Food-safety scandals (>70 mentions: 食安問題, 地溝油, 黑心油…)
-
General ethics / “黑心” distrust (~30)
-
Political stance / human-rights issues (~10)
-
Environmental harm (~8)
-
Personal dislike (taste, price, service) (individual cases)
Trusted Brands
| Brand | Count | |
|---|---|---|
| 246 | No trusted brand | 421 |
| 247 | Have but not specified | 68 |
| 0 | 義美 | 48 |
| 1 | Apple | 14 |
| 2 | 光泉 | 9 |
| ... | ... | ... |
| 109 | garena | 1 |
| 110 | Lego | 1 |
| 111 | Canon | 1 |
| 112 | 統一企業 | 1 |
| 124 | muji | 1 |
248 rows × 2 columns
Figure 5: College Student Trusted Brands
The following responses were counted as “no brand”: “無”, “沒有”, “沒有特別”, “🈚️”, “目前沒有”, “No”, “沒”, “沒有特別關注”, “沒有特別信任的”, “不知道”, “無特別選擇”, “目前沒有完全信任的”, “沒有特定的”, “沒有特定”, “沒有特別研究”, “目前沒有特別關注的品牌”,“N”, “none”, “無特別”, “目前無”, “沒有特別想到”, “沒有固定的”, “x”, “沒在買”, “nope”, “一時想不到…”, “沒有特別注意”, “無特別的品牌”, “無絕對信任的品牌”, “不確定你說的範圍”, “還沒有”
| Response category | Count | Share of all students |
|---|---|---|
| No trusted brand (any variant of “none / don’t have / can’t think of one”) |
421 | 48 % |
| Have trust but didn’t name it (e.g., “有”) |
68 | 8 % |
| Named a specific brand | 387 | 44 % |
| Total | 876 | 100 % |
| Rank | Brand | Count | % of all 876 |
|---|---|---|---|
| 1 | 義美 (I-Mei Foods) | 48 | 5.5 % |
| 2 | Apple | 27 | 3.1 % |
| 3 | MUJI | 14 | 1.6 % |
| 4 | Nike | 11 | 1.3 % |
| 5 | 光泉 (Kuang Chuan Dairy) | 9 | 1.0 % |
| 6 | 統一 (Uni-President) | 7 | 0.8 % |
| 7 | 里仁 (LiRen organic) | 6 | 0.7 % |
| 8 | NET (Taiwanese fashion chain) | 5 | 0.6 % |
| 9 | 主婦聯盟 (Moms in Union co-op) | 5 | 0.6 % |
| 10 | 全聯 (PX Mart) | 4 | 0.5 % |
Top-10 mentioned brands (after normalising obvious duplicates). After the top three, the distribution flattens quickly; in total, 248 different brand names were entered. High “no-brand” rate (48 %): Students are sceptical and reserve trust; they need a strong safety/ethics signal before committing loyalty.
Choice Experiments
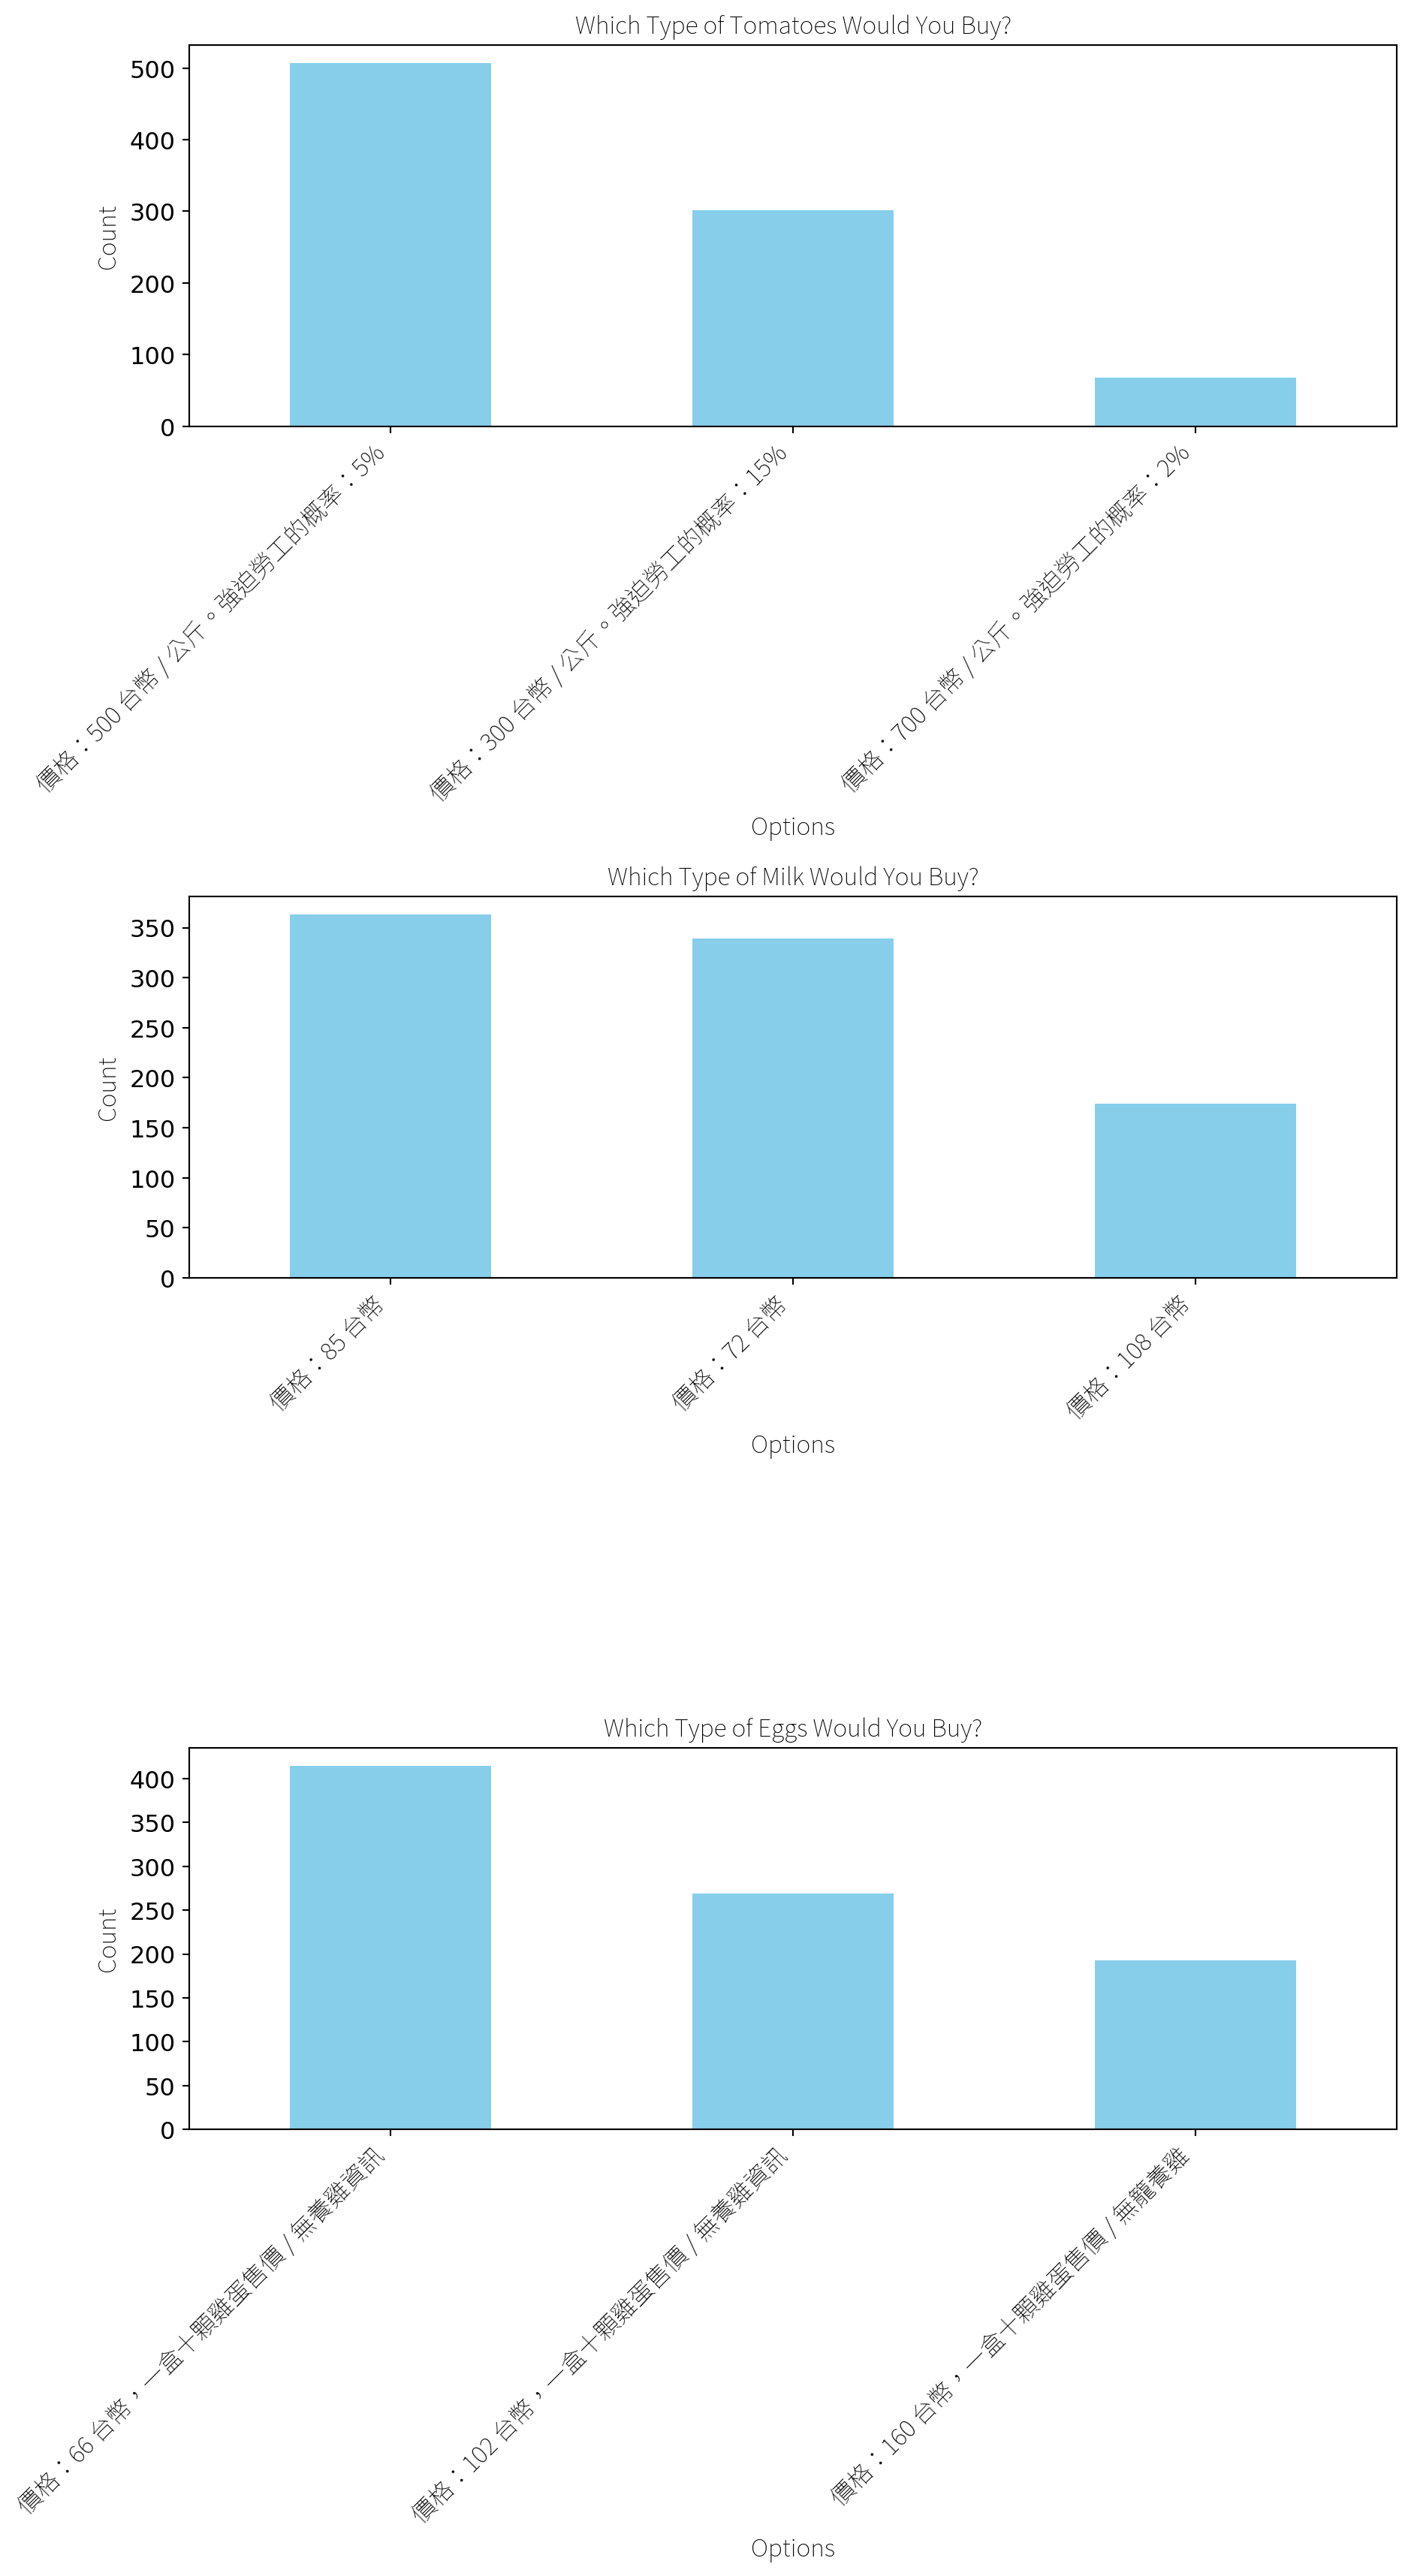
Figure 6: College Student Shopping Choice Experiment
| Product & Attributes | Choices | Respondents | Share | Interpretation |
|---|---|---|---|---|
| Tomatoes (Price × Forced-labor Risk) | 500 TWD/kg (5% risk) | 507 | 58% | Sweet-spot: most college students accept a mid price if risk is < 10%. |
| 300 TWD/kg (15% risk) | 301 | 34% | Price-first: about 1/3 of the respondents sacrifice ethics for a 40% discount. | |
| 700 TWD/kg (2% risk) | 68 | 8% | Ethical Premium: fewer than 1/10 of the respondents will pay +40% for the safest pick. | |
| Milk (Price Only) | 85 TWD | 363 | 41% | Slightly higher-priced carton wins; may signal perceived quality. |
| 72 TWD | 339 | 39% | Hardcore bargain hunters—pure price play. | |
| 108 TWD | 174 | 20% | Small niche is fine paying +27 % (brand / organic cue?). | |
| Eggs (Price × Animal-welfare Label) | 66 TWD / 10 eggs (no hen-welfare info) | 414 | 47% | Baseline: half of the respondents choose the cheapest “unknown welfare” tray. |
| 102 TWD / 10 eggs (no hen-welfare info) | 269 | 31% | Some will pay +54% even without extra welfare signal (brand/quality?) | |
| 160 TWD / 10 eggs (cage-free label) | 193 | 22% | About 1/5 of the respondents would pay +142% when hen welfare is certified. |